Easyalluvial 0.2.1 released
easyalluvial allows you to build exploratory alluvial plots (sankey diagrams) with a single line of code while automatically binning numerical variables. This releas 0.2.1 ensures tidyr 1.0.0 compatibility and fixes a bug around categorical variables for model response plots
Model Response Plots with Categorical Variables
This feature had som glitches before as edvardoss reported in this issue. If anybody else encounters some glitches or inconcistencies please report them as well.
We create a grid of all possible feature combinations and use an alluvial plot to visualise the model response.
Learn more about this feature in this previous blog post
suppressPackageStartupMessages( require(tidyverse) )
suppressPackageStartupMessages( require(easyalluvial) )
df = titanic %>%
select_if(is.factor)
set.seed(0)
m = randomForest::randomForest( Survived ~ ., df)
imp = m$importance
dspace = get_data_space(df, imp, degree = 3)
pred = predict(m, newdata = dspace,type = 'response')
p = alluvial_model_response(pred, dspace, imp, degree = 3)
grid = add_marginal_histograms(p, plot = F, data_input = df)
grid = add_imp_plot(grid = grid, p = p, data_input = df, plot = T)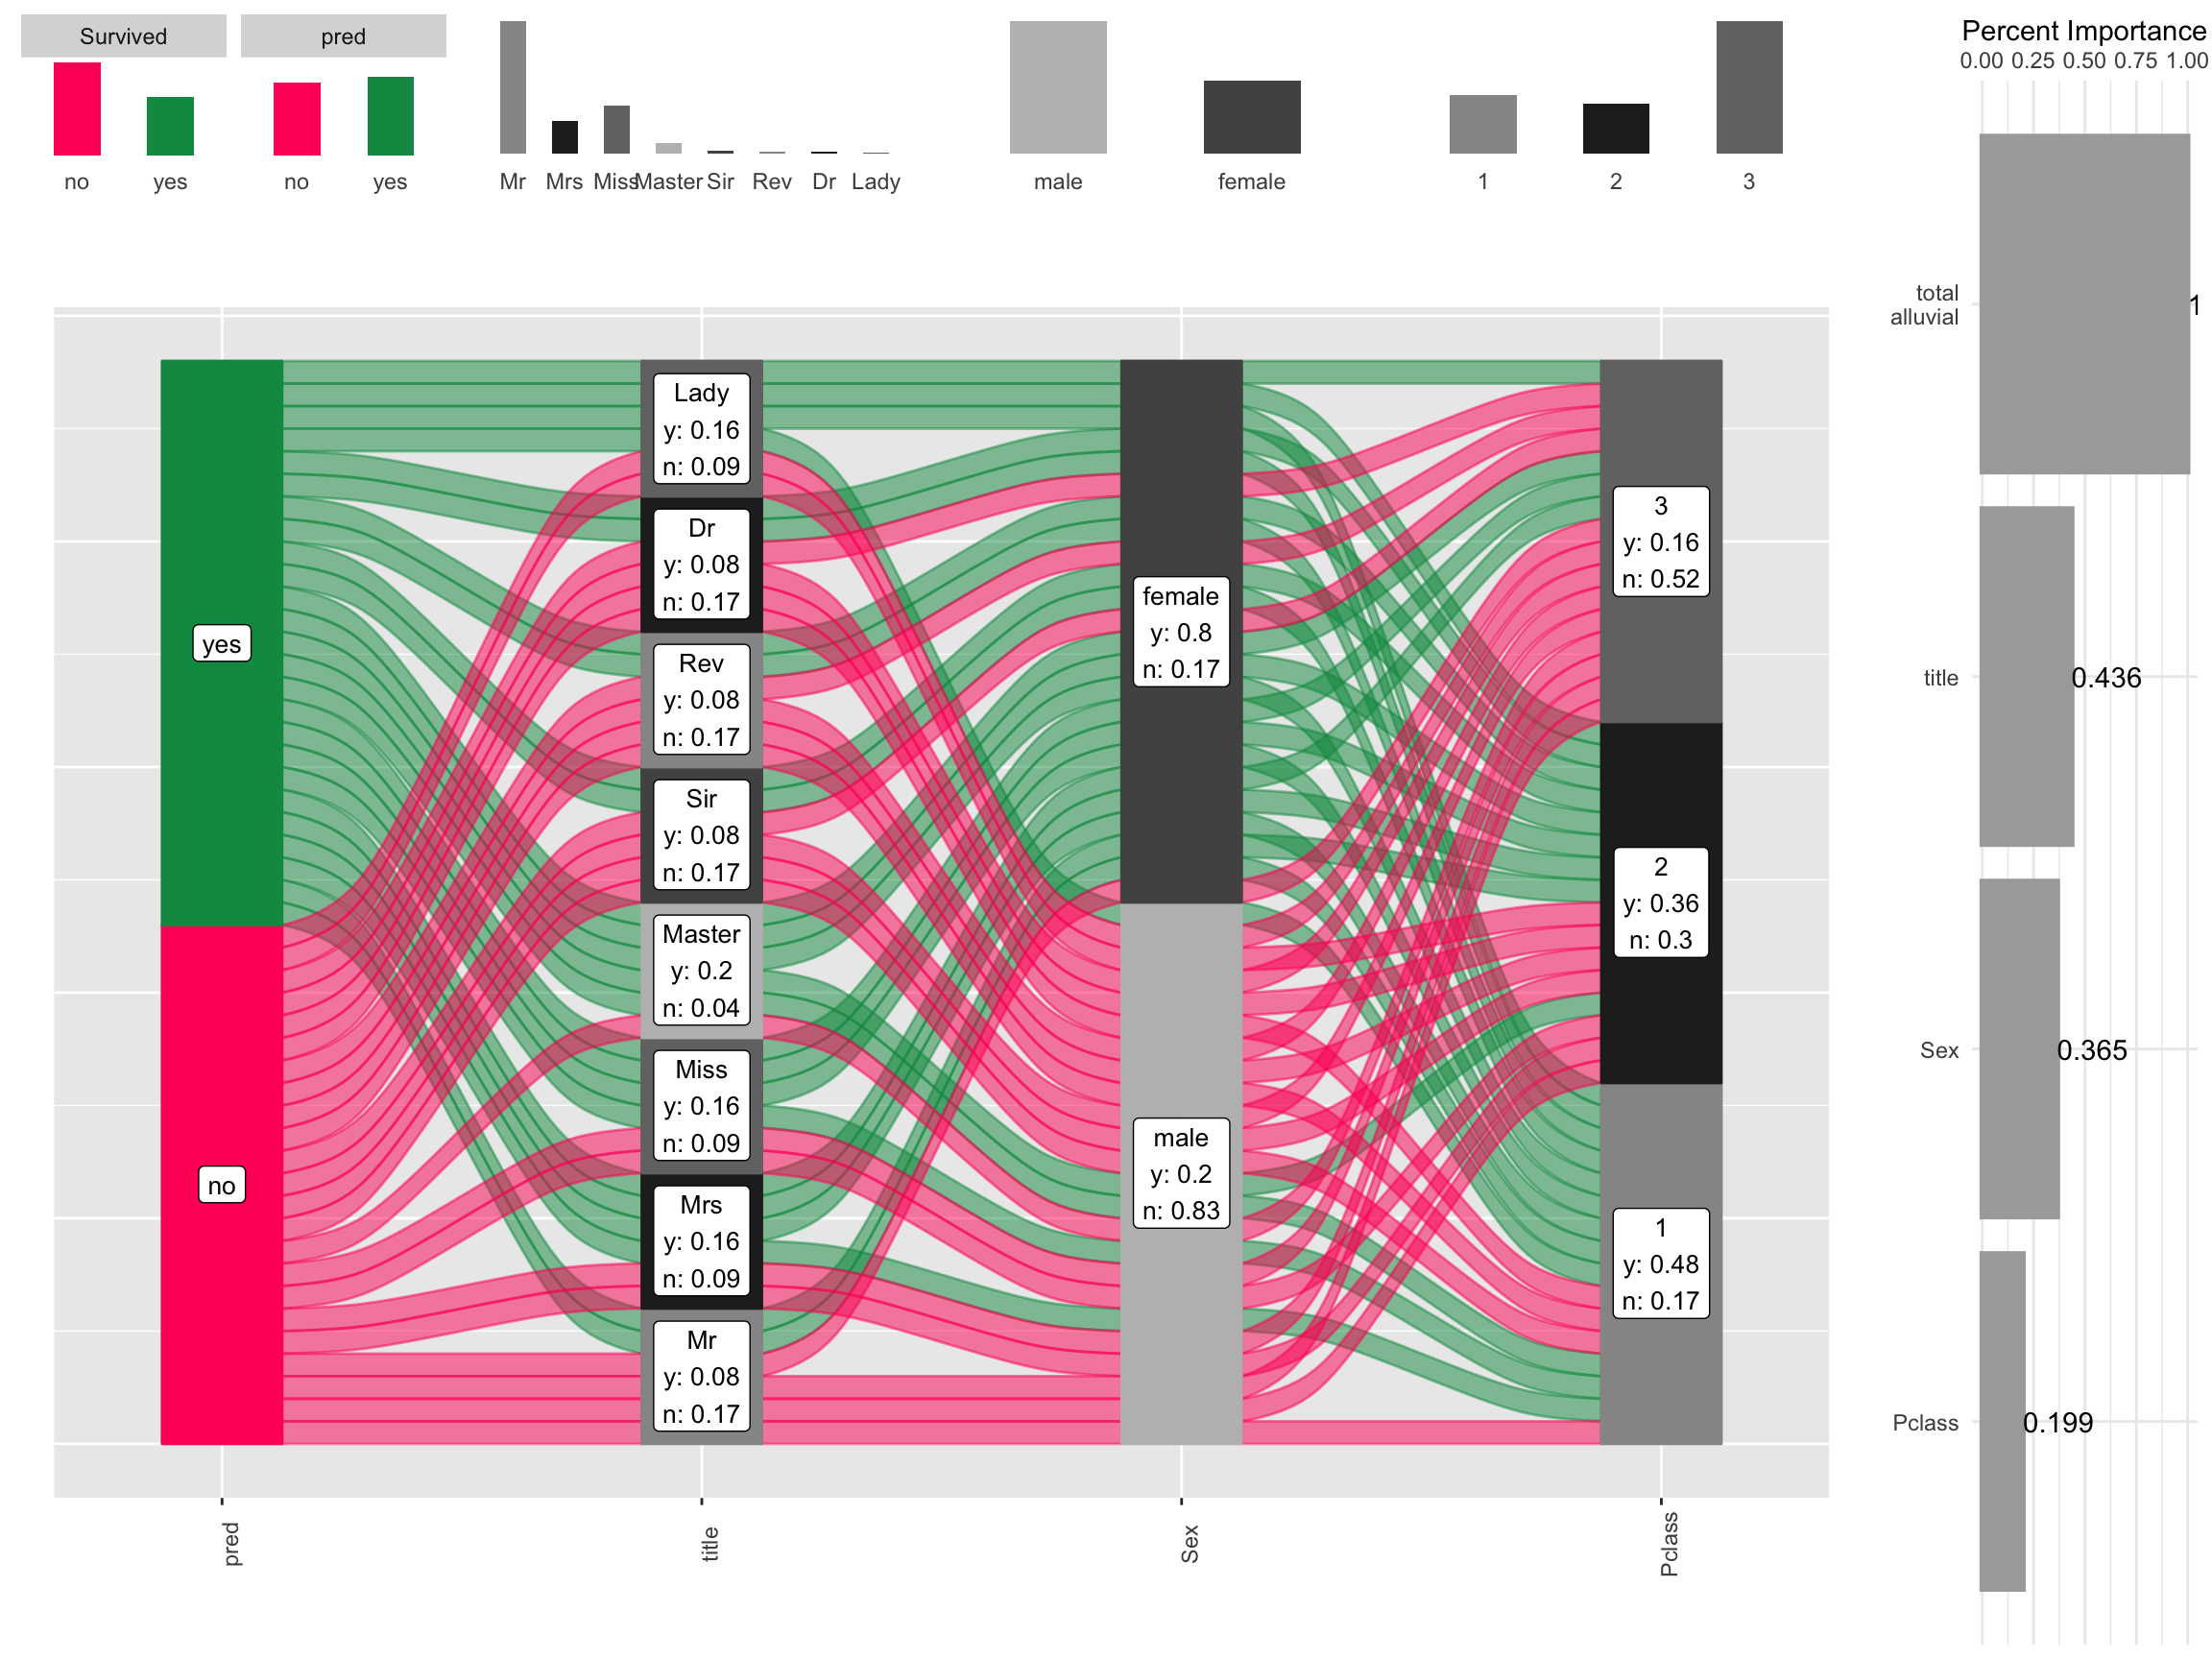
More changes
… NEWS.md