simaerep release 1.0.0
Simulate patient-related events in clinical trials with the goal of detecting over and under-reporting sites.
Monitoring reporting rates of patient-related events such as adverse events (AE) in clinical trials is important for patient safety. We use bootstrap-based simulation to assign over- and under-reporting probabilities to each site in a clinical trial. The method is inspired by the ‘infer’ R package and Allen Downey’s blog article: “There is only one test!”.
Key Risk Indicators
Statistical monitoring of clinical trial sites typical employs several key risk indicators which are operational metrics derived from activities at the clinical trial sites. The ratio of AEs is typically one of them, the ratio of issues occurring when treating and examininig patients according to the study protocol might be another one.
Release v1.0.0
Announcement
We are happy to announce the release of {simaerep} v1.0.0 and {gsm.simarep} v0.2.0 our open source R packages designed to detect clinical trial sites that are under- or over- reporting patient-level clinical events. We have condensed our experience and user feedback from the past 5 years to design a more professional user experience with default settings that reflect our latest recommendations. We have also adapted the algorithm to support the detection of over-reporting of low-incidence terminal events such as patient discontinuations. {gsm.simaerep} provides important data preprocessing functions and a standardized approach to integrate {simaerep} into an end-to-end analysis and reporting pipeline using the good statistical monitoring {gsm} framework.
Release Highlights
- New user interface for
simaerep()function with defaults reflecting the latest recommendations - Better output structure, over- and under-reporting probability combined into one score
- Support for low-incidence terminal events (e.g., patient discontinuations)
Demo
{simaerep}
suppressPackageStartupMessages(library(simaerep))
suppressPackageStartupMessages(library(dplyr))
suppressPackageStartupMessages(library(knitr))

set.seed(1)

df_visit <- sim_test_data_study(
  n_pat = 1000, # number of patients in study
  n_sites = 100, # number of sites in study
  ratio_out = 0.02, # ratio of sites with outlier
  factor_event_rate = -0.5, # rate of under-reporting
  # non-constant event rates based on gamma distribution
  event_rates = (dgamma(seq(1, 20, 0.5), shape = 5, rate = 2) * 5) + 0.1,
  max_visit = 20,
  max_visit_sd = 10,
  study_id = "A"
)

df_visit %>%
  select(study_id, site_id, patient_id, visit, n_event) %>%
  head(25) %>%
knitr::kable()| study_id | site_id | patient_id | visit | n_event |
|---|---|---|---|---|
| A | S0001 | P000001 | 1 | 0 |
| A | S0001 | P000001 | 2 | 2 |
| A | S0001 | P000001 | 3 | 2 |
| A | S0001 | P000001 | 4 | 4 |
| A | S0001 | P000001 | 5 | 6 |
| A | S0001 | P000001 | 6 | 7 |
| A | S0001 | P000001 | 7 | 7 |
| A | S0001 | P000001 | 8 | 7 |
| A | S0001 | P000001 | 9 | 7 |
| A | S0001 | P000001 | 10 | 7 |
| A | S0001 | P000001 | 11 | 7 |
| A | S0001 | P000001 | 12 | 7 |
| A | S0001 | P000001 | 13 | 7 |
| A | S0001 | P000002 | 1 | 3 |
| A | S0001 | P000002 | 2 | 3 |
| A | S0001 | P000002 | 3 | 5 |
| A | S0001 | P000002 | 4 | 8 |
| A | S0001 | P000002 | 5 | 8 |
| A | S0001 | P000002 | 6 | 9 |
| A | S0001 | P000002 | 7 | 9 |
| A | S0001 | P000002 | 8 | 9 |
| A | S0001 | P000002 | 9 | 9 |
| A | S0001 | P000002 | 10 | 9 |
| A | S0001 | P000002 | 11 | 9 |
| A | S0001 | P000002 | 12 | 9 |
evrep <- simaerep(df_visit, mult_corr = TRUE)

plot(evrep, study = "A")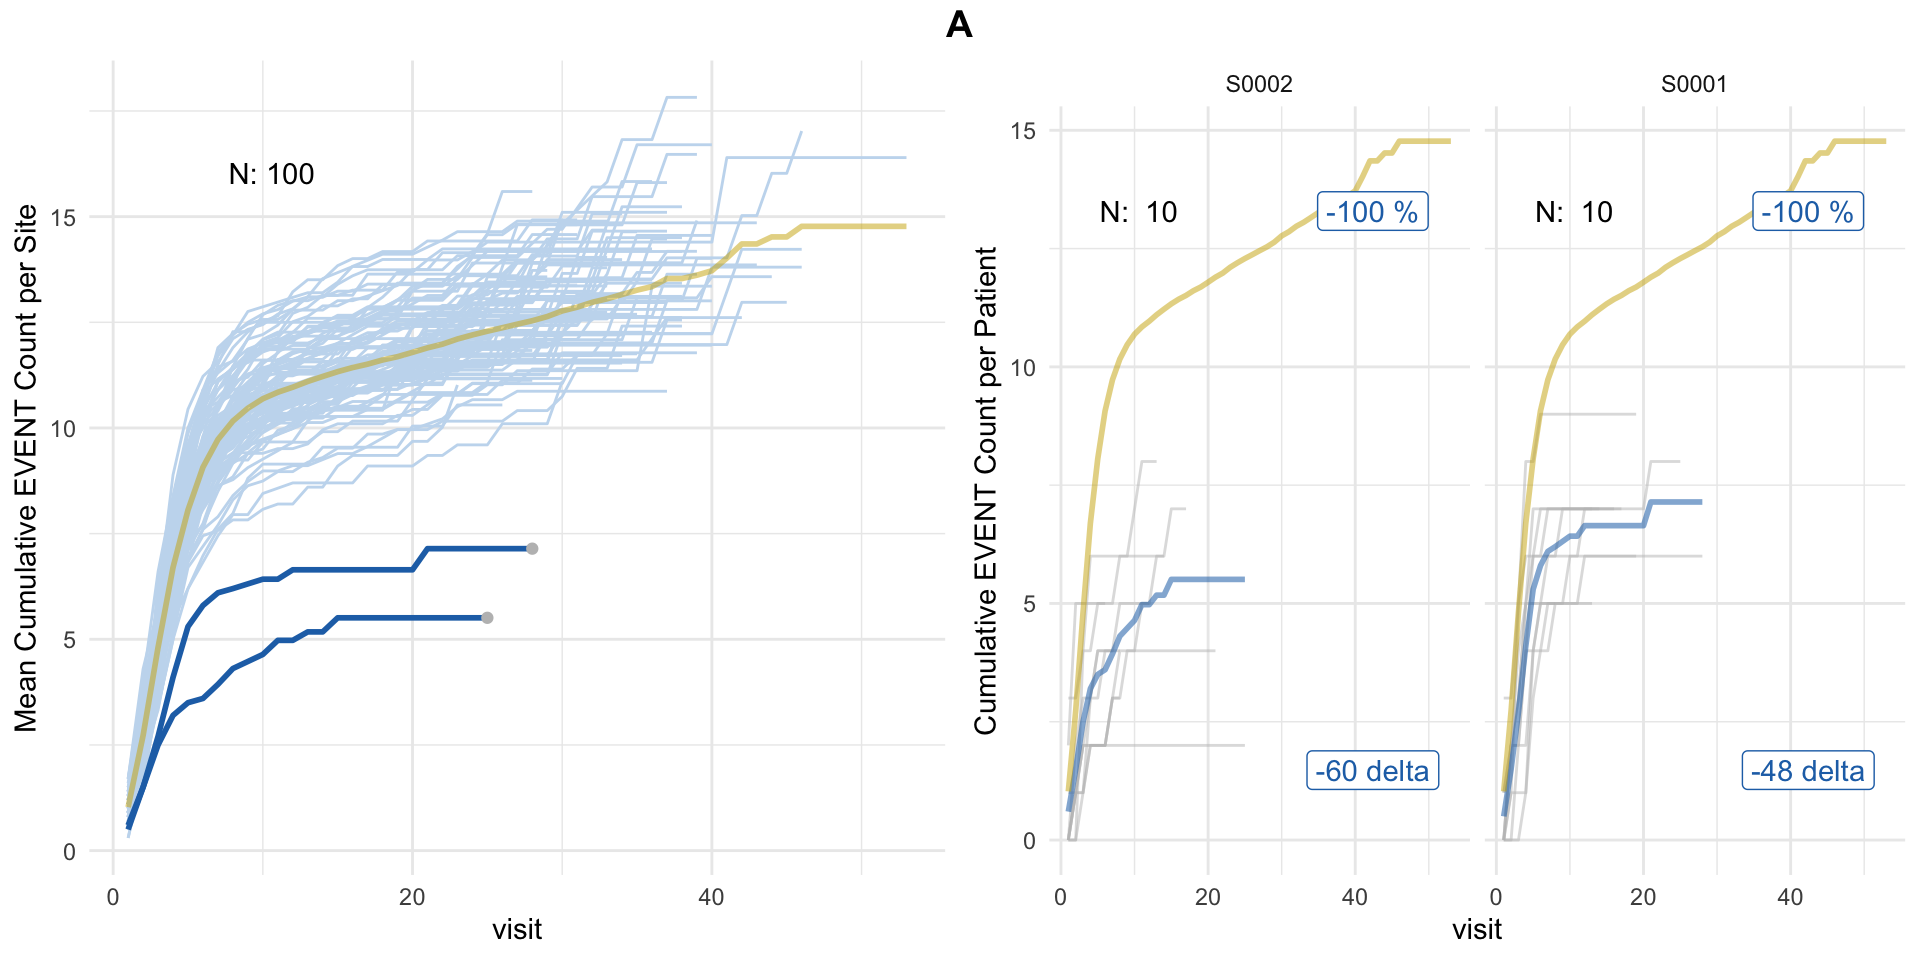
{gsm.simaerep}
library(gsm.simaerep)
library(gsm.kri)

dfInput <- Input_CumCount(
  dfSubjects = clindata::rawplus_dm,
  dfNumerator = clindata::rawplus_ae,
  dfDenominator = clindata::rawplus_visdt %>% dplyr::mutate(visit_dt = lubridate::ymd(visit_dt)),
  strSubjectCol = "subjid",
  strGroupCol = "siteid",
  strGroupLevel = "Site",
  strNumeratorDateCol = "aest_dt",
  strDenominatorDateCol = "visit_dt"
)

dfAnalyzed <- Analyze_Simaerep(dfInput)

dfFlagged <- Flag_Simaerep(dfAnalyzed, vThreshold = c(-0.99, -0.95, 0.95, 0.99))
## ℹ Sorted dfFlagged using custom Flag order: 2.Sorted dfFlagged using custom Flag order: -2.Sorted dfFlagged using custom Flag order: 1.Sorted dfFlagged using custom Flag order: -1.Sorted dfFlagged using custom Flag order: 0.#> ℹ Sorted dfFlagged using custom Flag order: 2.Sorted dfFlagged using custom Flag order: -2.Sorted dfFlagged using custom Flag order: 1.Sorted dfFlagged using custom Flag order: -1.Sorted dfFlagged using custom Flag order: 0.
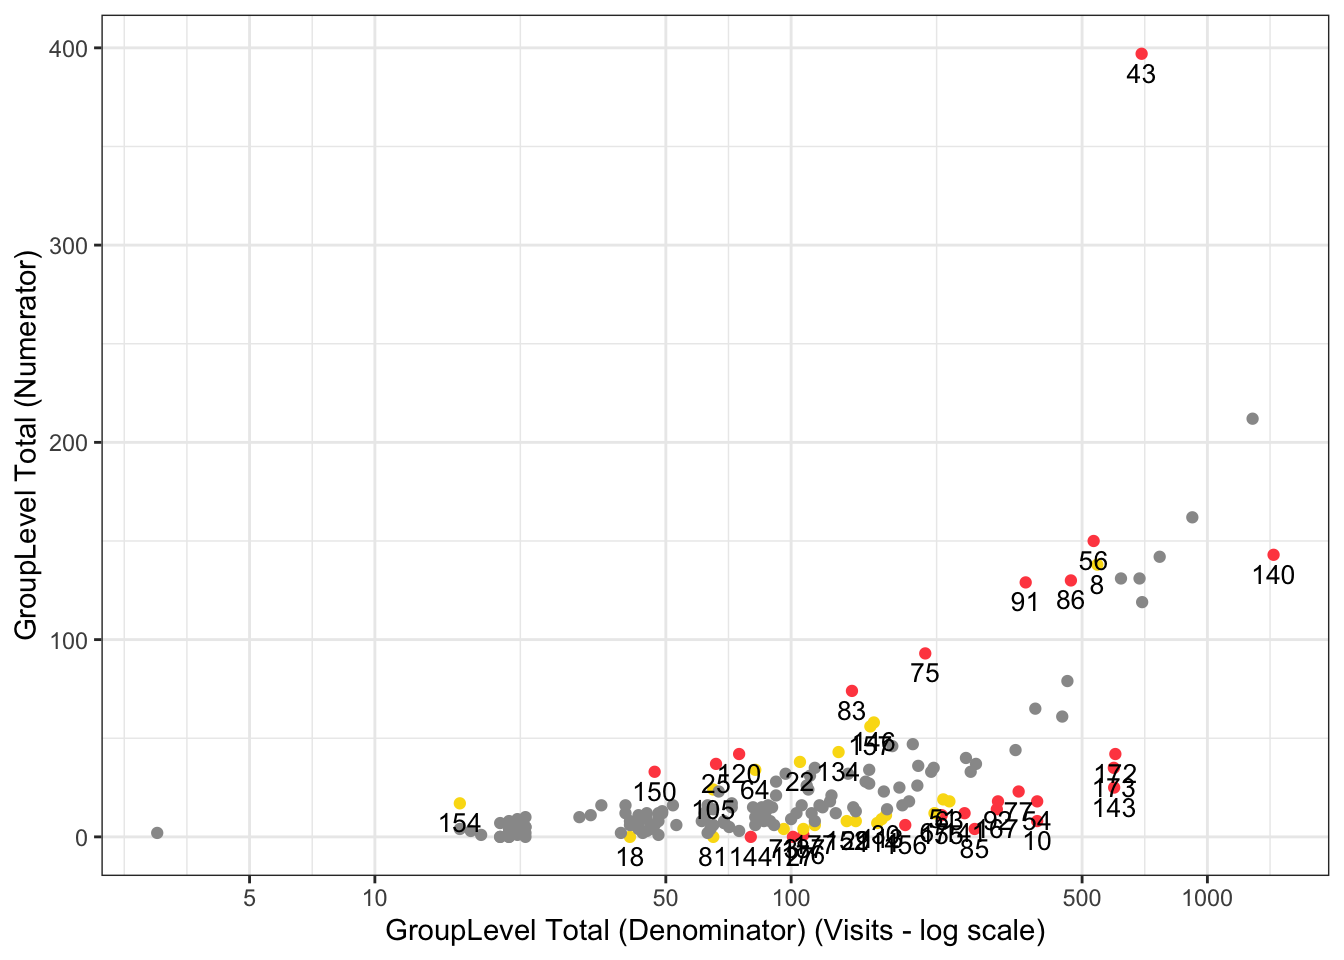
gsm.kri::Visualize_Scatter(
dfFlagged,
dfBounds = NULL,
strGroupLabel = "GroupLevel",
strUnit = "Visits"
)
IMPALA
simaerep has been published as workproduct of the Inter-Company Quality Analytics (IMPALA) consortium. IMPALA aims to engage with Health Authorities inspectors on
defining guiding principles for the use of advanced analytics to complement, enhance and accelerate current QA practices. simaerep has initially been developed at Roche but is currently evaluated by
other companies across the industry to complement their quality assurance activities (see testimonials).
![]()
Publications
Koneswarakantha, B., Adyanthaya, R., Emerson, J. et al. An Open-Source R Package for Detection of Adverse Events Under-Reporting in Clinical Trials: Implementation and Validation by the IMPALA (Inter coMPany quALity Analytics) Consortium. Ther Innov Regul Sci (2024). https://doi.org/10.1007/s43441-024-00631-8
Koneswarakantha, B., Barmaz, Y., Ménard, T. et al. Follow-up on the Use of Advanced Analytics for Clinical Quality Assurance: Bootstrap Resampling to Enhance Detection of Adverse Event Under-Reporting. Drug
Saf (2020).
https://doi.org/10.1007/s40264-020-01011-5